Showing posts with label Natural Hazard. Show all posts

Tuesday, 10 December 2013

A volcanic activity alert-level system for aviation: review of its development and application in Alaska

Tungurahua volcano in Ecuador
An ash cloud from an eruption of the Tungurahua volcano in Ecuador and the peak of the dormant Chimborazo volcano project through cloud cover in this photo taken from NASA's C-20A flying at 41,000 feet (12,500 meters) altitude about 100 miles (160 kilometers) northeast of Guayaquil, Ecuador on March 17, 2013. (c) NASA

In the the issue of the journal Natural Hazards published in December 2013 an article concerning the volcanic activity alert-level system for aviation. The authors are Marianne Guffanti and Thomas P. Miller from US Geological Survey. Here below the abstract.

An alert-level system for communicating volcano hazard information to the aviation industry was devised by the Alaska Volcano Observatory (AVO) during the 1989–1990 eruption of Redoubt Volcano. The system uses a simple, color-coded ranking that focuses on volcanic ash emissions: Green—normal background; Yellow—signs of unrest; Orange—precursory unrest or minor ash eruption; Red—major ash eruption imminent or underway. The color code has been successfully applied on a regional scale in Alaska for a sustained period. During 2002–2011, elevated color codes were assigned by AVO to 13 volcanoes, eight of which erupted; for that decade, one or more Alaskan volcanoes were at Yellow on 67 % of days and at Orange or Red on 12 % of days. As evidence of its utility, the color code system is integrated into procedures of agencies responsible for air-traffic management and aviation meteorology in Alaska. Furthermore, it is endorsed as a key part of globally coordinated protocols established by the International Civil Aviation Organization to provide warnings of ash hazards to aviation worldwide. The color code and accompanying structured message (called a Volcano Observatory Notice for Aviation) comprise an effective early-warning message system according to the United Nations International Strategy for Disaster Reduction. The aviation color code system currently is used in the United States, Russia, New Zealand, Iceland, and partially in the Philippines, Papua New Guinea, and Indonesia. Although there are some barriers to implementation, with continued education and outreach to Volcano Observatories worldwide, greater use of the aviation color code system is achievable.


Authors and affiliations:
Marianne Guffanti, Thomas P. Miller


Monday, 25 November 2013

Three attempts of earthquake prediction with satellite cloud images

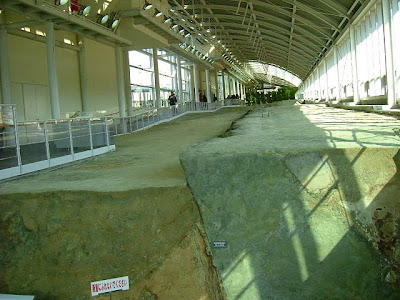
Nojima Fault
A section of the Nojima Fault, responsible for the 1995 Great Hanshin earthquake, preserved at Nojima Fault Preservation Museum. Picture taken at Nojima Fault Preservation Museum, Awaji Island, Japan. (c) Sakurai Midori
On Natural Hazards and Earth System Sciences G. Guangmeng and Y. Jie have been published a study where they attempt earthquake prediction by observing clouds from satellite images. Here below the abstract of the article.

Thermal anomalies detected from satellite data are widely reported. Nearly all the anomalies are reported after the quake. Here we report three earthquake predictions in Italy and Iran according to satellite cloud anomalies. These cloud anomalies usually show a linear pattern, stay there for hours and do not move with winds. According to these anomalies, we can give a rough estimation about impending earthquake activities. All the estimated dates and magnitudes are in good agreement with the earthquake facts, and the only unsatisfactory point is that the distance error is 100–300 km. Because the cloud anomaly is long, we can not reduce the distance error further. A possible way is to combine geophysical data and satellite data together to estimate the epicenter and this will increase the prediction accuracy.

This is an open article. Follow this link: Natural Hazards Earth System Sciences, 13, 91-95

Authors and affiliations:
G. Guangmeng and Y. Jie


Thursday, 21 November 2013

Tropical cyclone-related socio-economic losses in the western North Pacific region

This trackmap shows the tracks of all tropical cyclones which formed worldwide from 1950 to 2005. (c) Nilfanion

On the journal Natural Hazards and Earth System Sciences C. Welker and E. Faust have recently published an article concerning the socio-economic impacts of tropical cyclones. Here below the abstract of the article.

The western North Pacific (WNP) is the area of the world most frequently affected by tropical cyclones (TCs). However, little is known about the socio-economic impacts of TCs in this region, probably because of the limited relevant loss data. Here, loss data from Munich RE's NatCatSERVICE database is used, a high-quality and widely consulted database of natural disasters. In the country-level loss normalisation technique we apply, the original loss data are normalised to present-day exposure levels by using the respective country's nominal gross domestic product at purchasing power parity as a proxy for wealth. The main focus of our study is on the question of whether the decadal-scale TC variability observed in the Northwest Pacific region in recent decades can be shown to manifest itself economically in an associated variability in losses. It is shown that since 1980 the frequency of TC-related loss events in the WNP exhibited, apart from seasonal and interannual variations, interdecadal variability with a period of about 22 yr – driven primarily by corresponding variations of Northwest Pacific TCs. Compared to the long-term mean, the number of loss events was found to be higher (lower) by 14% (9%) in the positive (negative) phase of the decadal-scale WNP TC frequency variability. This was identified for the period 1980–2008 by applying a wavelet analysis technique. It was also possible to demonstrate the same low-frequency variability in normalised direct economic losses from TCs in the WNP region. The identification of possible physical mechanisms responsible for the observed decadal-scale Northwest Pacific TC variability will be the subject of future research, even if suggestions have already been made in earlier studies.

More information about the article: Natural Hazards Earth System Sciences, 13, 115-124

Authors and affiliations:
Deutsches Zentrum für Luft- und Raumfahrt (DLR), Institut für Physik der Atmosphäre, Münchner Straße 20, 82234 Oberpfaffenhofen, Germany
C. Welker* and E. Faust
Munich RE, Geo Risks Research/Corporate Climate Centre, Königinstraße 107, 80802 Munich, Germany
C. Welker*
*now at: University of Bern, Oeschger Centre for Climate Change Research and Institute of Geography, Hallerstraße 12, 3012 Bern, Switzerland


Monday, 18 November 2013

The near-Earth objects and their potential threat to our planet

Comet Bradfield from Cactus Flats in NE Colorado. (c) TheStarmon

D. Perna, M. A. Barucci, M. Fulchignoni published on the journal The Astronomy and Astrophysics Review a very interesting article concerning the potential threat from the near-Earth objects, namely asteroids, comet nuclei.
Here the abstract of the article.

The near-Earth object (NEO) population includes both asteroids (NEAs) and comet nuclei (NECs) whose orbits have perihelion distances q<1.3 AU and which can approach or cross that of the Earth. A NEA is defined as a “potentially hazardous asteroid” (PHA) for Earth when its minimum orbit intersection distance (MOID) comes inside 0.05 AU and it has an absolute magnitude H<22 mag (i.e. mean diameter > 140 m). These are big enough to cause, in the case of impact with Earth, destructive effects on a regional scale. Smaller objects can still produce major damage on a local scale, while the largest NEOs could endanger the survival of living species. Therefore, several national and international observational efforts have been started (i) to detect undiscovered NEOs and especially PHAs, (ii) to determine and continuously monitor their orbital properties and hence their impact probability, and (iii) to investigate their physical nature. Further ongoing activities concern the analysis of possible techniques to mitigate the risk of a NEO impact, when an object is confirmed to be on an Earth colliding trajectory. Depending on the timeframe available before the collision, as well as on the object’s physical properties, various methods to deflect a NEO have been proposed and are currently under study from groups of experts on behalf of international organizations and space agencies. This paper will review our current understanding of the NEO population, the scientific aspects and the ongoing space- and ground-based activities to foresee close encounters and to mitigate the effects of possible impacts.

Follow this link for more information about this article: The Astronomy and Astrophysics Review September 2013, 21:65

Authors and affiliations:
LESIA—Observatoire de Paris, CNRS, UPMC Univ. Paris 06, Univ. Paris-Diderot, 5 Place Jules Janssen, 92195, Meudon Principal Cedex, France
D. Perna, M. A. Barucci, M. Fulchignoni


Tuesday, 12 November 2013

Tsunami-generated turbidity current of the 2011 Tohoku-Oki earthquake

EEffect of the tsunami from the Tōhoku earthquake on a Japanese coast
Effect of the tsunami from the Tōhoku earthquake on a Japanese coast. (c) German Aerospace Center, Rapid Eye
A Japanese scientific team studied relationships between tsunami and turbidity current due to the 2011 Tohoku-Oki earthquake. The article has been recently published on the journal Geology. Here below the abstract.

We show the first real-time record of a turbidity current associated with a great earthquake, the Mw 9.0, 2011 Tohoku-Oki event offshore Japan. Turbidity current deposits (turbidites) have been used to estimate earthquake recurrence intervals from geologic records. Until now, however, there has been no direct evidence for large-scale earthquakes in subduction plate margins. After the 2011 Tohoku-Oki earthquake and tsunami, an anomalous event on the seafloor consistent with a turbidity current was recorded by ocean-bottom pressure recorders and seismometers deployed off Sendai, Japan. Freshly emplaced turbidites were collected from a wide area of seafloor off the Tohoku coastal region. We analyzed these measurements and sedimentary records to determine conditions of the modern tsunamigenic turbidity current. We anticipate our discovery to be a starting point for more detailed characterization of modern tsunamigenic turbidites, and for the identification of tsunamigenic turbidites in geologic records. 

Follow this link for more information about this article: Geology, November 2013, v. 41, p. 1195-1198

Authors and affiliations:

Department of Earth Sciences, Graduate School of Science, Chiba University, 1-33 Yayoicho, Inage-ku, Chiba 263-8522, Japan
Kazuno Arai

Division of Earth and Planetary Sciences, Graduate School of Science, Kyoto University, Kitashirakawa-Oiwakecho, Sakyo-ku, Kyoto 606-8502, Japan
Hajime Naruse

Nippon Marine Enterprises, Ltd., 14-1 Ogawa-cho, Yokosuka, Kanagawa 238-0004, Japan
Ryo Miura

Graduate School of Science and Engineering, Yamaguchi University, 1677-1 Yoshida, Yamaguchi, Yamaguchi 753-8512, Japan
Kiichiro Kawamura

Research Center for Prediction of Earthquakes and Volcanic Eruptions, Graduate School of Science, Tohoku University, 6-6 Aza-Aoba, Aramaki, Aoba-ku, Sendai, Miyagi 980-8578, Japan
Ryota Hino, Yoshihiro Ito

National Research Institute for Earth Science and Disaster Prevention, 3-1 Tennodai, Tsukuba, Ibaraki 305-0006, Japan
Daisuke Inazu

Faculty of Information Science and Technology, Osaka Institute of Technology, 1-79-1 Kitayama, Hirakata, Osaka 576-0196, Japan
Miwa Yokokawa

Department of Civil Engineering, Hokkaido University, Nishi 8, Kita 13, Kita-ku, Sapporo, Hokkaido 060-8628, Japan
Norihiro Izumi

Center for Advanced Marine Core Research, Kochi University, B200 Monobe, Nankoku, Kochi 783-8502, Japan
Masafumi Murayama

Institute for Research on Earth Evolution (IFREE), Japan Agency for Marine-Earth Science and Technology (JAMSTEC), 2-15 Natsushima-cho, Yokosuka, Kanagawa 237-0061, Japan
Takafumi Kasaya

Tuesday, 29 October 2013

Recent hydrological and geochemical research for earthquake prediction in Japan

Global earthquake epicenters.  (c)NASA, DTAM project team
The last issue of the journal Natural Hazards is devoted to the topic: earthquake prediction. We have already reported the article "Earthquake prediction: 20 years of global experiment" and now we propose an other article written by Norio Matsumoto, Naoji Koizumi affiliated to the Geological Survey of Japan.
They take into account hydrological and geochemical aspects in earthquake prediction, as the following abstract reports.

Hydrological and geochemical studies for earthquake prediction in Japan during the last two decades are reviewed. Following the 1995 Hyogo-ken Nanbu (Kobe) earthquake, the central approach to research on earthquake prediction was modified. Instead of precursory detection, emphasis was placed on understanding the entire earthquake cycle. Moreover, the prediction program for the anticipated Tokai earthquake was revised in 2003 to include the detection of preslip-related precursors. These changes included the promotion of the following hydrological and geochemical studies for earthquake prediction: (1) development and/or application of statistical methods to extract small fluctuations from hydrological/geochemical data, (2) evaluation of the detectability of preslip-related anomalies in terms of groundwater levels in wells in the Tokai region, and (3) establishment of a new groundwater and borehole strain observation network for Nankai and Tonankai earthquake prediction research. The following basic geochemical studies were carried out: (1) development of a new monitoring system using a quadrupole mass spectrometer, (2) experimental studies on hydrogen generation by the grinding of rock and crystal powders, (3) comprehensive monitoring of groundwater gas and precise crustal deformation, and (4) mantle-derivative helium observation to compare with seismic velocity structures and the distribution of non-volcanic tremors. Moreover, hydrological and geochemical investigations related to the evolution of fault zones were introduced within the framework of fault zone drilling projects.

Follow the link below to go to article website:
Natural Hazards    November 2013, Volume 69, Issue 2, pp 1247-1260
 

Affiliations:
Geological Survey of Japan, National Institute of Advanced Industrial Science and Technology (AIST), AIST Tsukuba Central 7, 1-1-1 Higashi, Tsukuba, Ibaraki, 305-8567, Japan
Norio Matsumoto, Naoji Koizumi

Friday, 18 October 2013

Earthquake prediction: 20 years of global experiment

Vladimir G. Kossobokov (Institute of Earthquake Prediction Theory and Mathematical Geophysics - Moscow) in this article published by the journal Natural Hazard, presents the state of art in earthquake prediction in the last 20 years. Herebelow the abstract of the article.


Earthquake professionals have for many decades recognized the benefits to society from reliable earthquake predictions, but uncertainties regarding source initiation, rupture phenomena, and accuracy of both the timing and magnitude of the earthquake occurrence have oftentimes seemed either very difficult or impossible to overcome. The problem is that most of these methods cannot be adequately tested and evaluated either because of (a) lack of a precise definition of “prediction” and/or (b) shortage of data for meaningful statistical verification. This is not the case for the pattern recognition algorithm M8 designed in 1984 for prediction of great, Magnitude 8, earthquakes, hence its name. By 1986, the algorithm was rescaled for applications aimed at smaller magnitude earthquakes, down to M5+ range, and since then it has become a useful tool for systematic monitoring of seismic activity in a number of test seismic regions worldwide. After confirmed predictions of both the 1988 Spitak (Armenia) and the 1989 Loma Prieta (California) earthquakes, a “rigid test” to evaluate the efficiency of the intermediate-term middle-range earthquake prediction technique has been designed. Since 1991, each half-year, the algorithm M8 alone and in combination with its refinement MSc has been applied in a real-time prediction mode to seismicity of the entire Earth, and this test outlines, where possible, the areas in the two approximations where magnitude 8.0+ and 7.5+ earthquakes are most likely to occur before the next update. The results of this truly global 20-year-old experiment are indirect confirmations of the existing common features of both the predictability and the diverse behavior of the Earth’s naturally fractal lithosphere. The statistics achieved to date prove (with confidence above 99 %) rather high efficiency of the M8 and M8-MSc predictions limited to intermediate-term middle- and narrow-range accuracy. These statistics support the following general conclusions—(1) precursory seismic patterns do exist; (2) the size of an area where precursory seismic patterns show up is much larger than that of the source zone of the incipient target earthquake; (3) many precursory seismic patterns appear to be similar, even in regions of fundamentally different tectonic environments; and (4) some precursory seismic patterns are analogous to those in advance of extreme catastrophic events in other complex nonlinear systems (e.g., magnetic storms, solar flares, “starquakes”, etc.)—that are of high importance for further searches of the improved earthquake forecast/prediction algorithms and methods.


Affiliations:

Vladimir G. Kossobokov 

Russian Academy of Sciences, Institute of Earthquake Prediction Theory and Mathematical Geophysics, 84/32 Profsoyuznaya Street, 117997, Moscow, Russian Federation
 

Institut de Physique du Globe de Paris, 1, rue Jussieu, 75238, Paris, France


Thursday, 17 October 2013

Trace elements in scalp hair of children chronically exposed to volcanic activity (Mt. Etna, Italy)

Etna
(c) Josep Renalias
This article has been written by D. Varrica, E. Tamburo, G. Dongarrà and F. Sposito of Dip. Scienze della Terra e del Mare, Palermo - Italy.


The aim of this survey was to use scalp hair as a biomonitor to evaluate the environmental exposure to metals and metalloids of schoolchildren living around the Mt. Etna area, and to verify whether the degree of human exposure to trace elements is subject to changes in local environmental factors.
Twenty trace elements were determined in 376 samples of scalp hair from schoolboys (11–13 years old) of both genders, living in ten towns located around the volcanic area of Mt. Etna (Sicily). The results were compared with those (215 samples) from children living in areas of Sicily characterized by a different geological setting (reference site). As, U and V showed much higher concentrations at the volcanic site whereas Sr was particularly more abundant at the reference site. Linear Discriminant Analysis (LDA) indicated an Etna factor, made up of V, U and Mn, and a second factor, concerning the reference site, characterized by Ni and Sr, and to a lesser extent by Mo and Cd. Significant differences in element concentrations were also observed among three different sectors of Mt. Etna area. Young people living in the Mt. Etna area are naturally exposed to enhanced intakes of some metals (V, U, Mn) and non-metals (e.g., As) than individuals of the same age residing in other areas of Sicily, characterized by different lithologies and not influenced by volcanic activity. The petrographic nature of local rocks and the dispersion of the volcanic plume explain the differences, with ingestion of water and local food as the most probable exposure pathways.


Affiliations:
Dip. Scienze della Terra e del Mare (DiSTeM), via Archirafi 36, 90123 Palermo, Italy
D. Varrica, E. Tamburo, G. Dongarrà and F. Sposito


Wednesday, 16 October 2013

Tornado Debris Characteristics And Trajectories During The 27 April 2011 Super Outbreak As Determined Using Social Media Data

© Miroslav Vajdić

The authors are John A. Knox, Jared A. Rackley, Alan W. Black, Michael Butler, Corey Dunn, Taylor Gallo, Melyssa R. Hunter, Lauren Lindsey, Minh Phan and Robert Scroggs of the University of Georgia USA; Vittorio A. Gensini of the College of DuPage, Glen Ellyn, Illinois - USA; Synne Brustad of the University of Oslo - Norway

Using publicly available information gleaned from over 1700 found-and-returned objects on the “Pictures and Documents found after the 27 April 2011 Tornadoes” Facebook page, the authors have created a database of 934 objects lofted by at least 15 different tornadoes during the 27 April 2011 Super Outbreak in the southeast United States. Analysis of the takeoff and landing points of these objects using GIS and high-resolution numerical trajectory modeling techniques extends previous work on this subject that used less specific information for much smaller sets of tracked tornado debris. It was found that objects traveled as far as 353 km, exceeding the previous record for the longest documented tornado debris trajectory. While the majority of debris trajectories were 10° to the left of the average tornado track vector, the longest trajectories exhibited a previously undocumented tendency toward the right of the average tornado track vector. Based on results from a high-resolution trajectory model, a relationship between this tendency and the altitude of lofting of debris is hypothesized, with the debris reaching the highest altitudes taking the rightmost trajectories. The paper concludes with a discussion of the pros and cons of using social media information for meteorological research.


Affiliations: 
Department of Geography, University of Georgia, Athens, Georgia 
John A. Knox , Jared A. Rackley , and Alan W. Black

Meteorology Program, College of DuPage, Glen Ellyn, Illinois 
Vittorio A. Gensini


Department of Geography, University of Georgia, Athens, Georgia 
Michael Butler , Corey Dunn , Taylor Gallo , Melyssa R. Hunter , Lauren Lindsey , Minh Phan , and Robert Scroggs


Department of Geosciences, University of Oslo, Oslo, Norway
Synne Brusta 


Tuesday, 15 October 2013

Structural interpretation of the great earthquakes of the last millennium in the central Himalaya

(c) Michel Royon / Wikimedia Commons
The authors of the article are J.-L. Mugnier, A. Gajurel, P. Huyghe, R. Jayangondaperumal, F. Jouanne, B. Upreti. They are affiliated to Université de Savoie - France,
Tribhuvan University - Nepal and Wadia Institute of Himalayan Geology, Dehradun, Uttarakhand - India

A major question about the Himalaya remains open: does a great earthquake (like the Mw ~ 8.1 1934 earthquake) release all the strain stored by the Tibet–India convergence during the preceding interseismic period and only that strain, or can it also release a background store of energy that remained unreleased through one or more earlier earthquakes and so potentially engender giant events or a relatively random sequence of events?
To consider this question, the history of the great earthquakes of the last millennium is investigated here by combining data provided by the historical archives of Kathmandu, trenches through surface ruptures, isoseismal damage mapping, seismites, and the instrumental record. In the Kathmandu basin, the location of the epicenter of the 1934 earthquake was determined from the arrival of high-energy P-waves that caused sedimentary dikes and ground fractures perpendicular to the epicenter azimuth. The epicenter of the Mw ~ 7.6 1833 earthquake can therefore be determined analogously from dike orientation, and its location to the NE of Kathmandu indicates an overlap with the Mw ~ 8.1 1934 rupture. The 1934 earthquake released strain not released by the 1833 earthquake.
Comparison of the historical records of earthquakes in Kathmandu with 14C ages from paleo-seismic trenches along the Himalayan front suggests that: (1) the 1344 Kathmandu event ruptured the surface as far away as Kumaon and was therefore a giant Mw ≥ 8.6 earthquake; and (2) the 1255 event that destroyed Kathmandu is attested by surface ruptures in central and western Nepal and by seismites in soft sediment as far away as Kumaon.
Geometric and rheologic controls for the different types of ruptures during the medium (Mw ~ 7), great (Mw ≥ 8), and giant (Mw > 8.4) earthquakes are illustrated in structural cross-sections. It is found that the epicenters of great Himalayan earthquakes are located on the basal thrust farther north or close to the locked zone, which is defined from geodetic measurements of regional deformation during the interseismic period; this suggests that great earthquakes initiate in a wide transition zone between exclusively brittle and exclusively creeping regimes, the extent of which depends on the dip of the Main Himalayan Thrust.
The succession of the great earthquakes during the last millennium has released all the 20-m millennial Himalayan convergence; even in the central seismic gap which has been locked since 1505, the millennial seismic release rate is close to the convergence rate. Nonetheless, no evidence of a succession of characteristic earthquakes has been found: the ~ 1100, 1833, and 1934 earthquakes in the eastern Himalaya are characterized neither by constant displacement nor by constant recurrence. Furthermore, some great earthquakes do not release all the strain elastically stored by the Himalayan and Tibetan upper crust: after the 1255 event, there was still the potential for a slip of several meters for the Mw ~ 8.1 1505 event. This suggests a rather random release of seismic energy; great earthquakes could occur anytime and in any part of the central Himalaya. Furthermore, a future giant earthquake of Mw ≥ 8.6 cannot be excluded.


Affiliations:
ISTerre, Université de Savoie, CNRS, Université Joseph Fourier, Batiment les Belledonnes, Université de Savoie, F-73376, Le Bourget du Lac Cedex, France
J.-L. Mugnier
A. Gajurel
P. Huyghe 
F. Jouanne

Department of Geology, Tribhuvan University, Ghantaghar, Kathmandu, Nepal
A. Gajurel
B. Upreti

Wadia Institute of Himalayan Geology, Dehradun, Uttarakhand, India
R. Jayangondaperumal